


Crude and Product Tankers Overview
Fleet Profiles, Breakevens, TCE Performance, Supply, Demand and Valuation

We may have a beneficial long/short position in some of the shares mentioned via stock ownership, options, or other derivatives.
This presentation expresses the opinion of the author and is provided for informational purposes only and should not be construed as investment advice or an offer or solicitation to buy or sell securities.
The material is not intended to be used as a general guide to investing, or as a source of any specific investment recommendations.
After having looked at dry bulk companies, in this article we will do a similar analysis for crude and product tanker equities, by looking at fleet profiles, costs/breakevens, and valuation metrics(mainly forward looking).
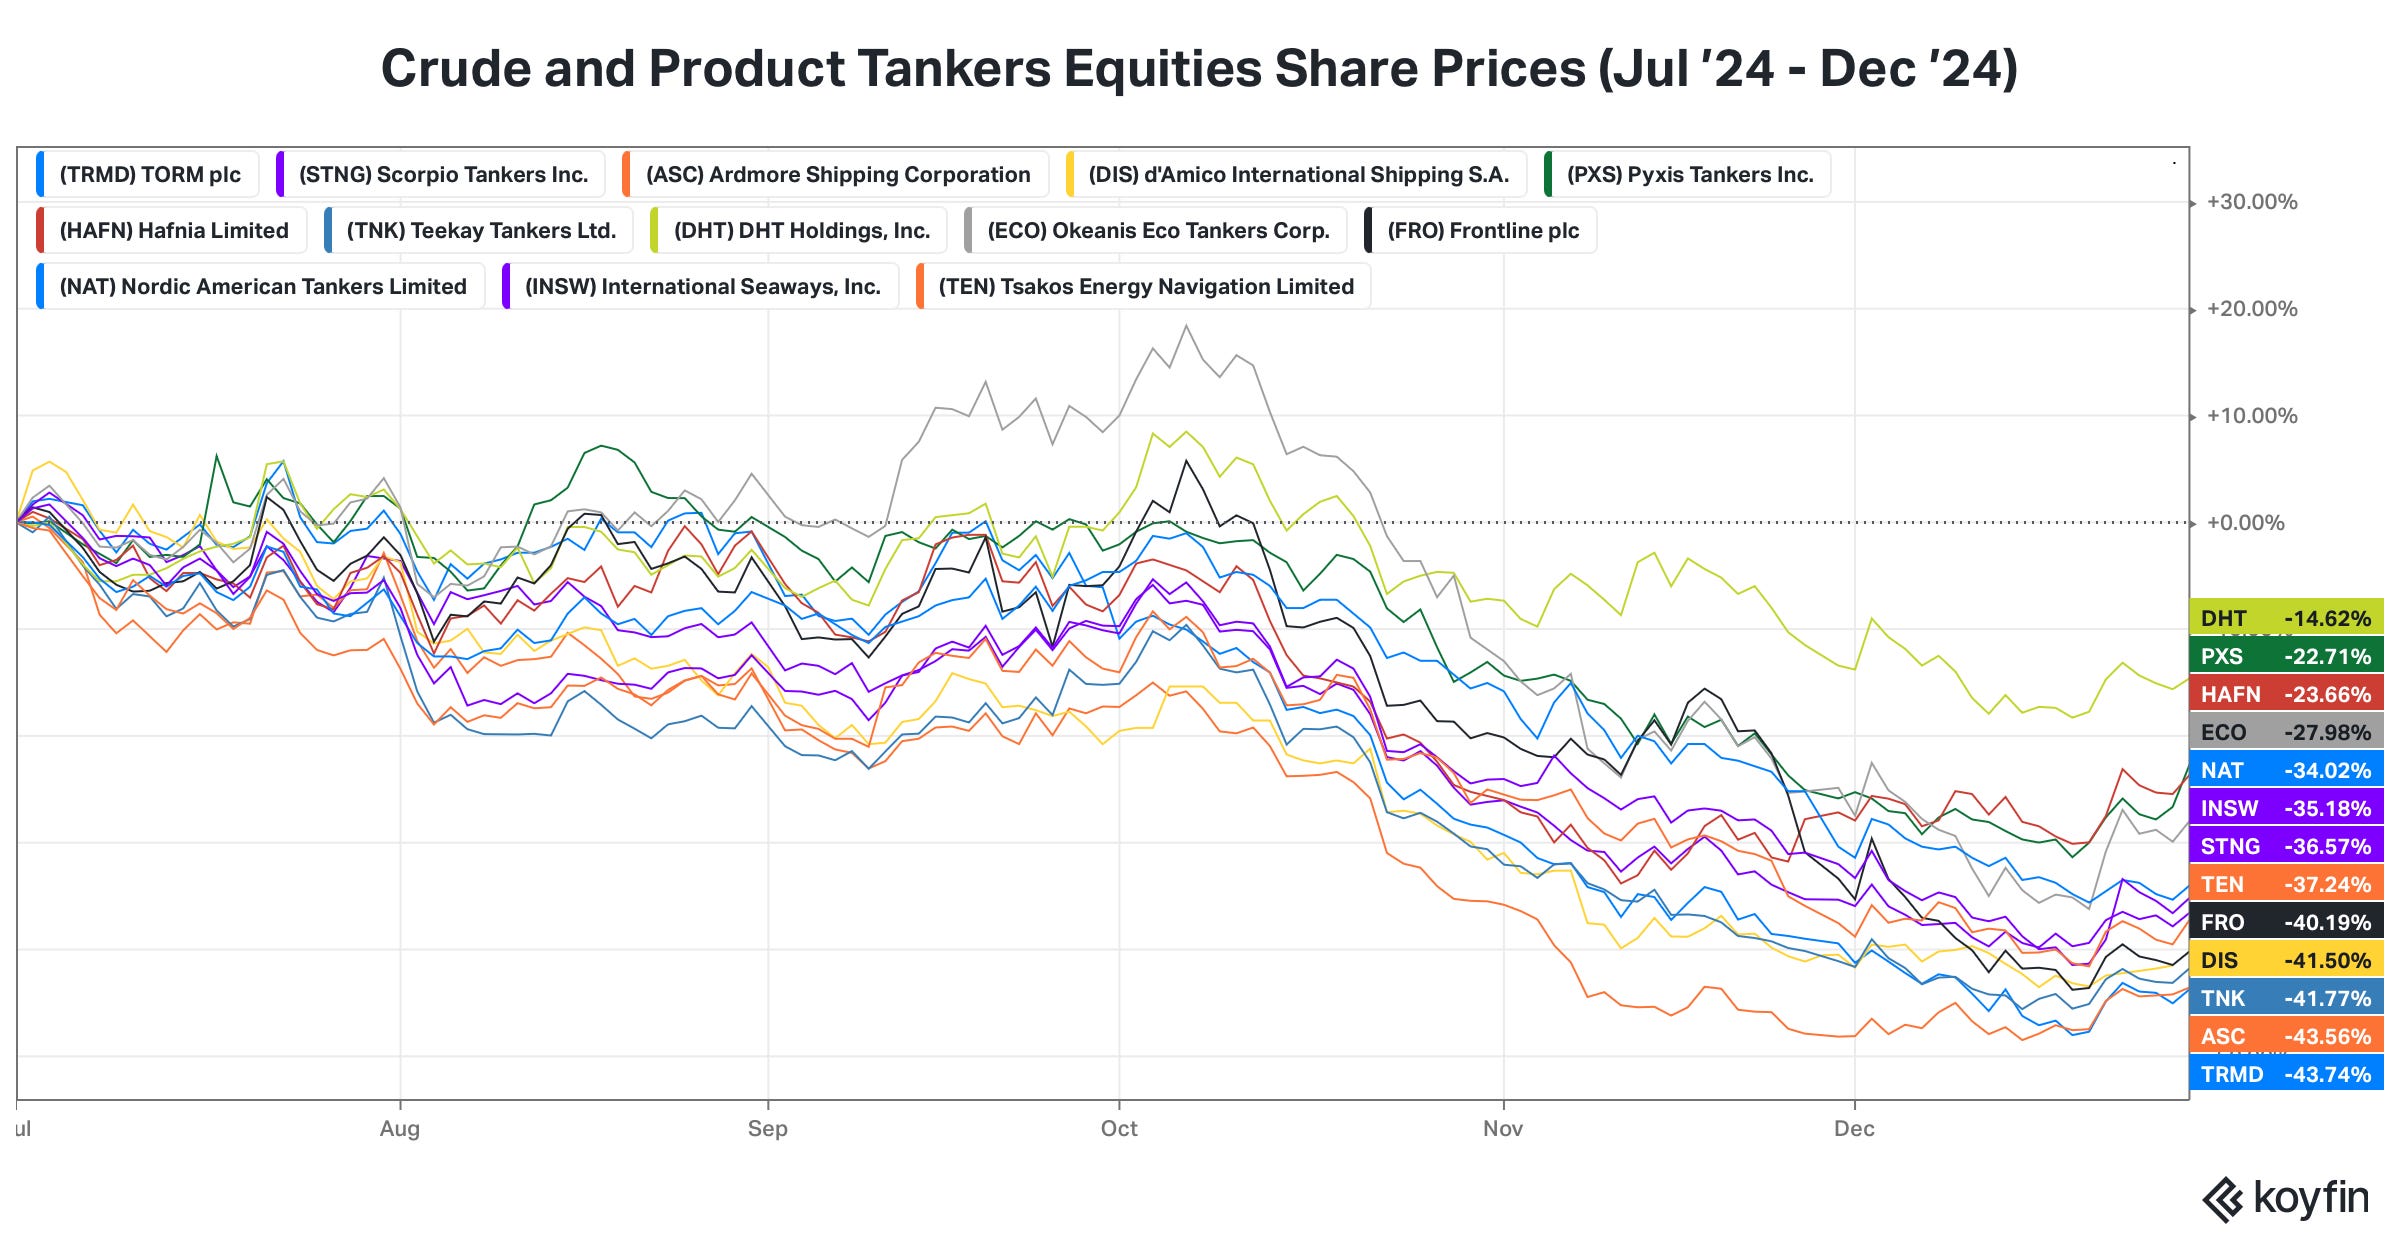
Both crude and product tanker rates had a disappointing Q3 and Q4’24, with rates averaging as per below table:

Equities reacted negatively to this (as expected) and dropped an average of 34% between the start of Q3 ‘24 and the end of 2024.
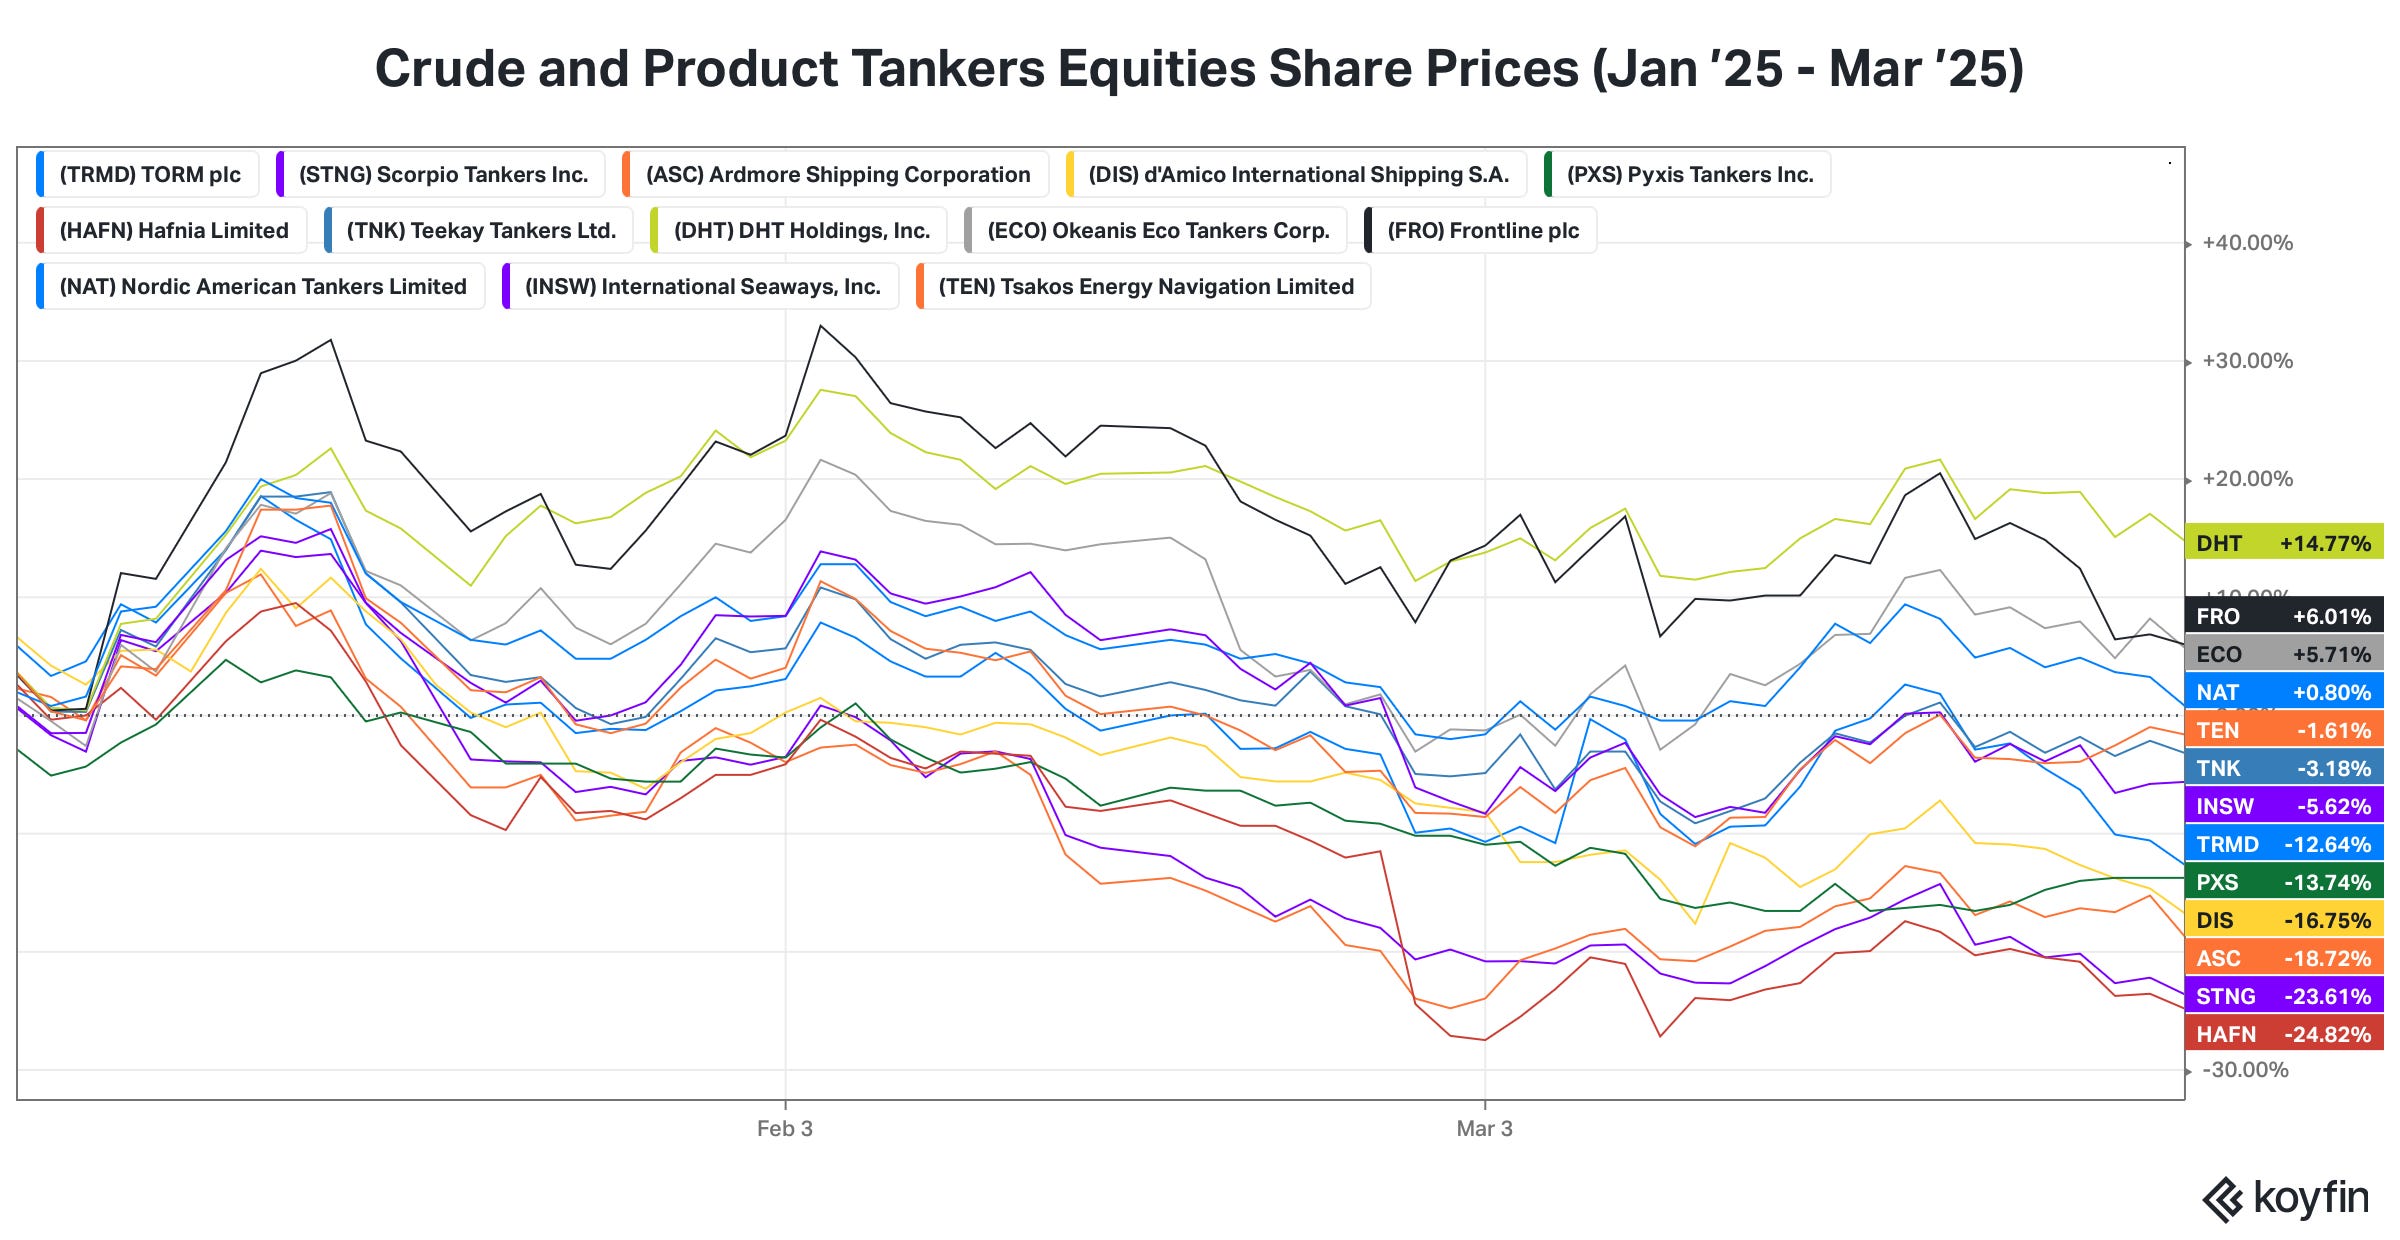
Following the sanctioning of ca. 180 tankers linked to the Russian trade and an increase in “pressure” on Iran by the Trump administration, rates rebounded. After an initial bounce, most equities gave up their YTD gains and are in negative territory, with the exception of DHT, FRO and ECO (due also to their heavy VLCC weight).
Despite this, we believe that there are still a lot of uncertainties (mainly related to demand), and it is not straightforward what will be the catalysts for sustained increases in rates (other than more sanctions/military action against Iran).
The companies analysed are:
Torm (Ticker: TRMD and TRMD-A.CO)
Scorpio Tankers (Ticker: STNG)
Ardmore Shipping (Ticker: ASC)
D’Amico International Shipping (Ticker: DIS.MI)
Pyxis Tankers (Ticker: PXS)
Hafnia (Ticker: HAFN and HAFNI.OL)
Teekay Tankers (Ticker: TNK)
DHT Holdings (Ticker: DHT)
Okeanis Eco Tankers (Ticker: ECO and OET.OL)
Frontline (Ticker: FRO and FRO.OL)
Nordic American Tankers (Ticker: NAT)
International Seaways (Ticker: INSW)
Tsakos Energy Navigation (Ticker: TEN)
Share prices are as of 31th March 2025.
Fleet Profiles and Breakevens
Among Product Tanker companies, Hafnia, Torm and Scorpio Tankers have the largest fleet at 115, 95 and 99 owned vessels, respectively.
Pyxis Tankers has by far the smallest fleet at just 6 vessels.
Looking at Crude Tanker companies, Frontline is the largest company, with 81 owned ships, while Okeanis is the smallest at 14 vessels.

Okeanis and Frontline are also the two companies with the most modern fleets (with an average age of 5.6 and 6.8 years, respectively), while Teekay Tankers and Nordic American Tankers have the oldest fleets (13.4 and 12.8 average age, respectively).
If we look at scrubbers penetration we can see how DHT Holdings and Okeanis are the only companies with 100% of the fleet scrubber-fitted.
In the product tanker space, it is worth noting the high percentage of scrubbers for Torm and Scorpio Tankers, both at around 75-80% of the fleet.

Starting from product tankers and looking at fleet compositions (n. of ships), we can see how Scorpio Tankers is the company with the largest exposure to LR2s at 38%, followed by Torm at 22%.
D’Amico and Hanfia are the only two listed companies with a considerable exposure to the LR1 sector, at 19% and 26%, respectively.
Finally, looking at MRs we can see how Ardmore has the largest exposure at 73%, followed by Torm (67%) and D’Amico (63%); notable mention also to International Seaways, with 54% of the fleet being MRs.
Moving to crude tankers, DHT Holdings is the only pure-play on VLCCs, with Okeanis and Frontline being the other two companies with VLCC exposure >50%.
Looking at mid-size Nordic American Tankers has a 100% exposure to the Suezmax sector, with Teekay and Okeanis coming behind at 58% and 43%, respectively.
In terms of Aframax/LR2 exposure, Teekay and Tsakos have the largest exposure at 41% and 44%.
We believe the above is important when deciding on how to allocate funds between stocks, given the very different dynamics (both supply and demand-wise) between dry bulk segments.

Moving to breakevens, we can see how Pyxis Tankers and D’Amico have the lowest Opex + G&A per day among product tankers (it also includes management/technical fees, where applicable), while Frontline is, by far, the best company among crude tanker owners..
By contrast, Scorpio Tankers has the highest costs among product tanker owners and Teekay Tankers among crude tanker owners (followed closely by Nordic American Tankers).
If we move to the P&L and Cash breakevens, before drawing any conclusions (i.e. lower breakevens are preferable), we should consider average vessel size (e.g. VLCC-heavy fleets will have higher breakevens than MR-heavy fleets), financial leverage and age of the fleet.
Among product tanker owners, Ardmore has, by far, the lowest cash breakeven, thanks to its negative net LTV, while among crude tanker owners Teekay Tankers ranks best.
On the other hand, Torm (among product tankers), Okeanis and Frontline (among crude tankers) have the highest cash breakeven at $17,000, $29,600 and $28,000, respectively.
If for Okeanis and Frontline this can be justified by having the youngest fleets (which justify the higher leverage), this cannot be said for Torm, which despite an average age of 12 years, it has the highest leverage among the large product tanker owners.
Nevertheless, to be noted that Torm has consistently outperformed peers on TCE metrics (more details in the next section) and, hence, the higher breakevens are “mitigated” by this.
TCE Performance

Starting from product tankers, we can see how all companies have comfortably beaten the indexes in all segments.
As for dry bulk, this can be explained by higher % of scrubbers and more modern vessels (i.e. Eco-design) vs global fleets.
Looking at each company’s relative performance vs other listed peers.
On LR2s we can see how Torm is the clear outperformer, and this has consistently been the case (below an historical graph with Torm outperformance on LR2s).

If we look at the worst performers, it is notable to see Scorpio Tankers, especially given that Scorpio’s LR2s have an average age of just 9.2 years (vs 11.2 for Torm) and 100% scrubber fitted (vs 57% for Torm).
Moving to LR1s, International Seaways is the clear “outlier”, but this can be explained by the fact that most of them are employed by Flopec; if we look at Hafnia and Torm (the other two listed companies with LR1 exposure), we can see how reported TCEs are similar.
Looking at the MR segment, we can see how, other than Scorpio’s underperformance (again), all reported TCEs are quite levelled in Q4 ‘24 (to be noted that D’Amico spot TCEs also include LR1s, hence why it is higher than peers).
Finally, for what concerns Handy tankers we can see (again) Scorpio’s underperformance vs peers, with Hafnia, on the other hand, reporting strong TCEs, relative to its listed peers.
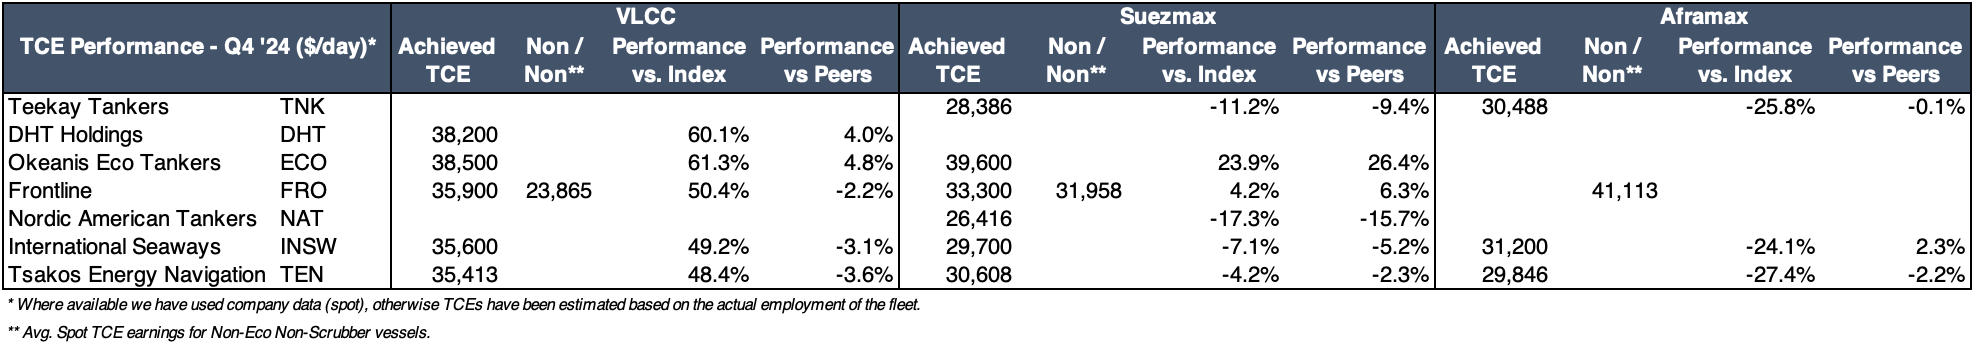
Moving to crude tankers, we can see how TCE performance for VLCCs was quite levelled in Q4 ‘24, with DHT Holding and Okeanis, slightly above peers.
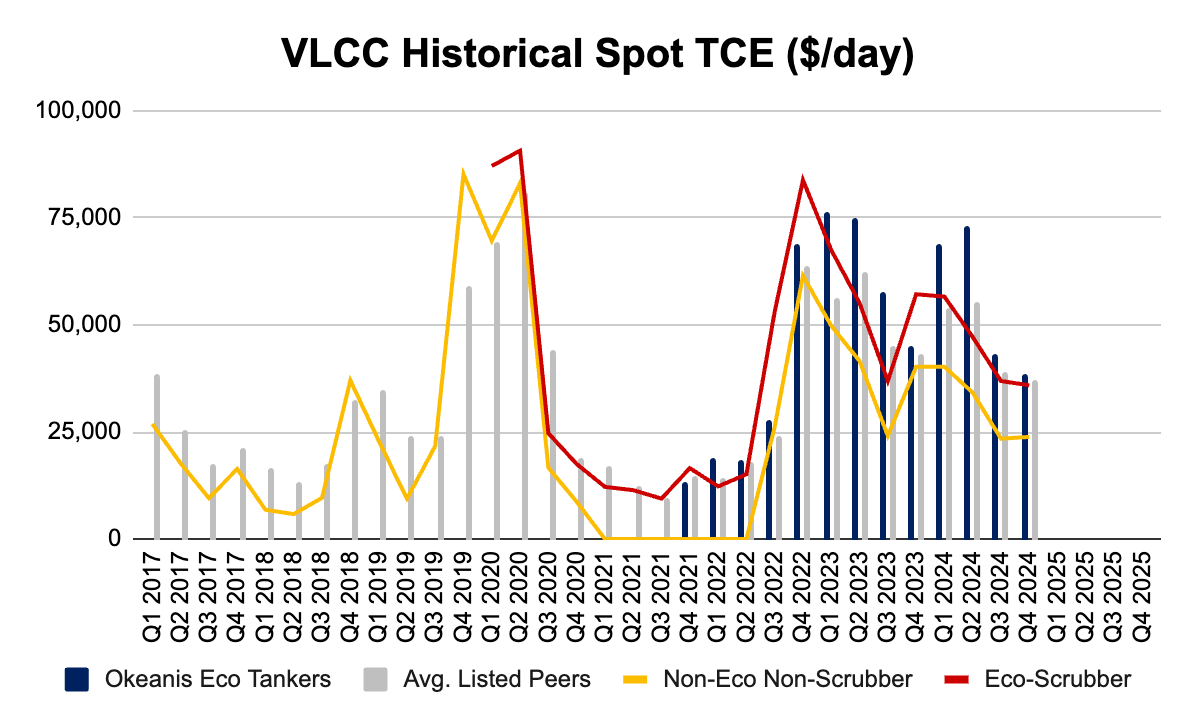
Nevertheless, if we look at historical data (above) we can see how Okeanis has massively outperformed all listed peers over time.
On VLCCs, this can be explained by a superior commercial strategy (e.g. more triangulation, transporting clean products in Q3’24, etc.) and by the fact that the company can boost the youngest fleet (all scrubber-fitted) among listed peers.
Looking at Suezmaxes, we can see, again, how Okeanis outperformed all peers by a staggering 26% in Q4 ‘24; worth noting that also Frontline performance was slightly above peers.
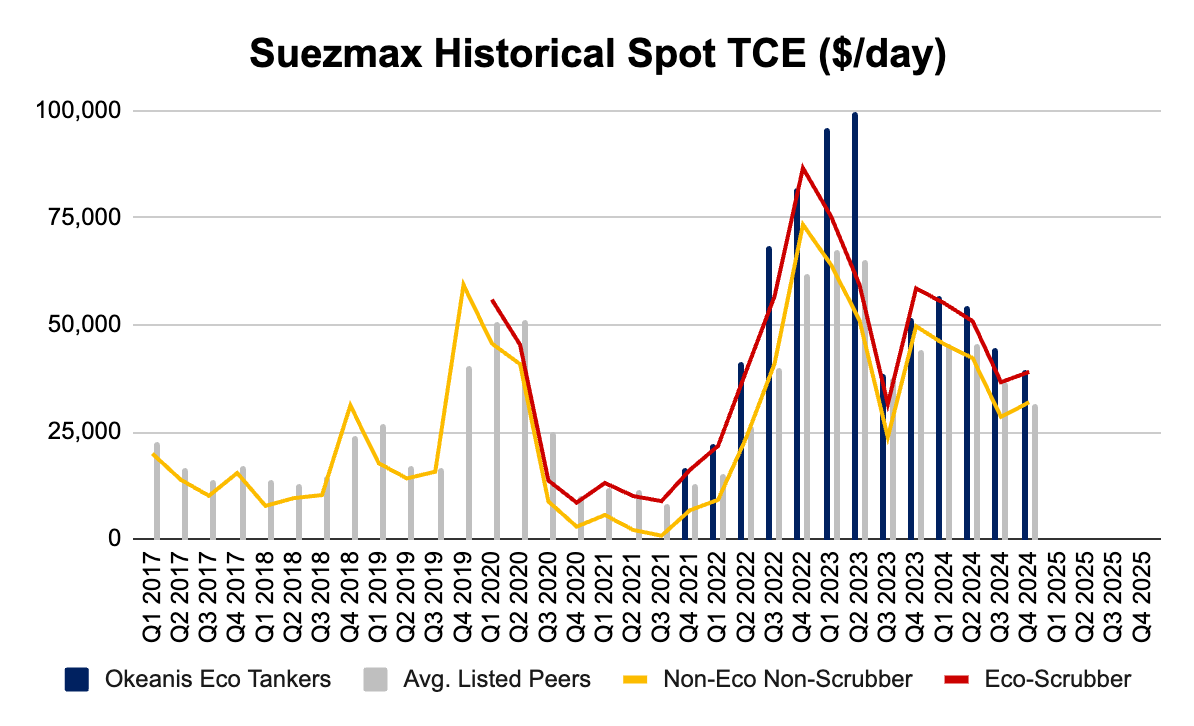
If we look at historical outperformance we can see, again how well Okeanis did (+34% vs peers since Q4 ‘21); again, this can be explained by a superior commercial strategy (which for Suezmax can also be explained by the fact that the company legally transported Russian oil in 2022 and 2023) and a very modern and scrubber-fitted fleet.
Finally, looking at Aframaxes, we can see how performance among peers is levelled with all companies being in a tight -/+2% range.
Supply Dynamics

According to Clarkson’s data, we can see how the global crude orderbook stands at 10.8% of the existing fleet, while for product tankers the figure is 19.3%.
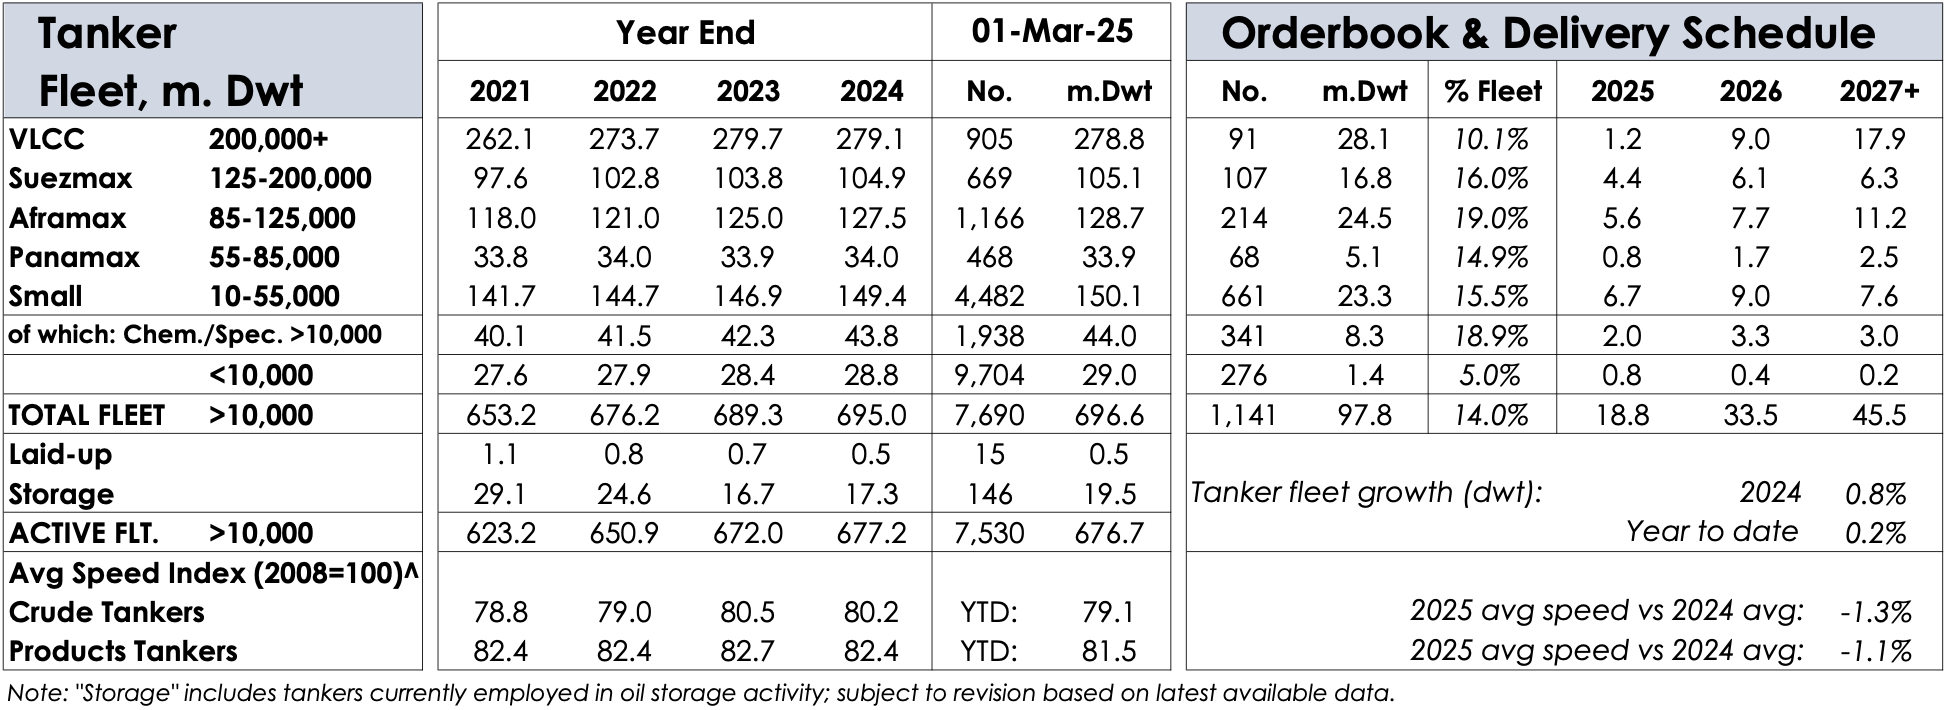
Analysing each segment separately, we note that VLCCs have the lowest orderbook at 10.1%, with just 0.4% fleet growth expected in 2025 (assuming no scrapping).
On the latter (i.e. scrapping), to be noted that in the past 3 years, an yearly average of 0.4m dwt have been scrapped (it has already reached 0.6m dwt in 2025 to date).
Moving to the Suezmax segment, we can see how the orderbook is at 16% of the existing fleet, with ca. 4.2% expected fleet growth in 2025 (assuming no scrapping); to be noted that, in the past 3 years, the yearly average dwt amount of ships scrapped was 0.5m dwt.
Looking at the Aframax/LR2 sector we can see how the orderbook stands at 19.0%, with 4.4% expected fleet growth in 2025. Again, in terms of scrapping the annual average of the last 3 years was 0.6m dwt.
For LR1s the orderbook stands at 14.9%, with ca. 2.4% expected fleet growth in 2025 (assuming no scrapping)
Finally moving to the smaller sizes (i.e. chemical, handy and MRs) we can see how the orderbook stands at 15.5% of the existing fleet, with ca. 4.5% expected fleet growth in 2025 (assuming no scrapping); to be noted that, in the past 3 years, the yearly average dwt amount of ships scrapped was 0.7m dwt.
Other than the VLCC segment, which has a constructive supply picture, we can see how all other segments have a relatively high orderbook, with contracting having substantially increased since 2022 (although it slowed down since the end of 2024).

In terms of deliveries, 2026 will be a heavy delivery year for all sectors. It seems that there has been an increased appetite for scrapping older vessels (especially VLCCs), mainly as a consequence of sanctions; it will be interesting to see if this trend continues, as it might provide some “relief” with reduced net fleet growth in the coming years.
Demand Dynamics and Freight Rates
As we said in our dry bulk overview, we believe that looking at the demand dynamics for a sector and try to “predict” where rates will be is a “fool’s errand”, given the amount of variables at play.
As such, also for tankers, we will try to look at the “larger picture”, focusing on what we believe might be some important topics/catalysts.
Oil Demand
We will not enter into any detail on this as there are tens of great oil analysts that follow the markets very closely, but we agree with the view that oil demand from China, which is the largest importer of crude oil, may be peaking.
This is due, in our view, to various factors, among which the most relevant are:
Increasing NEV sales in China: in February, of the total 1.386 million vehicles sold (+25% y-o-y), 51% (0.7 million) were ICE, 31% (0.43 million) were BEV and 19% (0.26 million) were PHEV.
The market share of ICE cars has fallen at an average 0.9% per month, since September 2020.

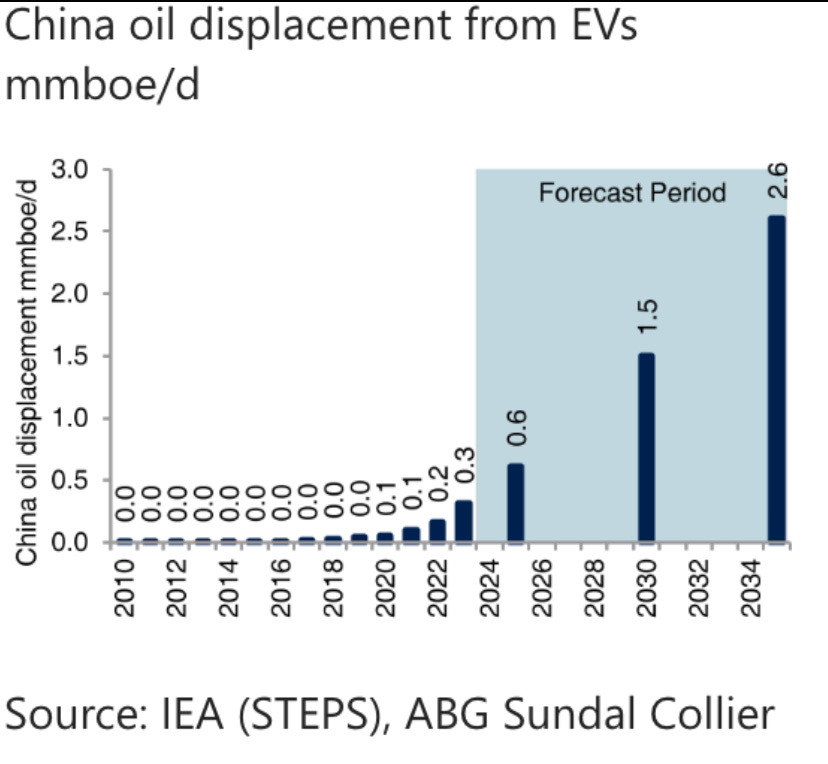
This trend is clearly causing a displacement of Chinese oil demand and according to the IEA, China's EV fleet is expected to reach 42 million vehicles by 2025 and 115 million and 218 million vehicles by 2030 and 2035.
This is expected to displace 2.6 million barrels of oil per day per year, by 2035 (to be noted that, currently, Chinese oil demand is equal to ca. 16.7 million barrels per day).

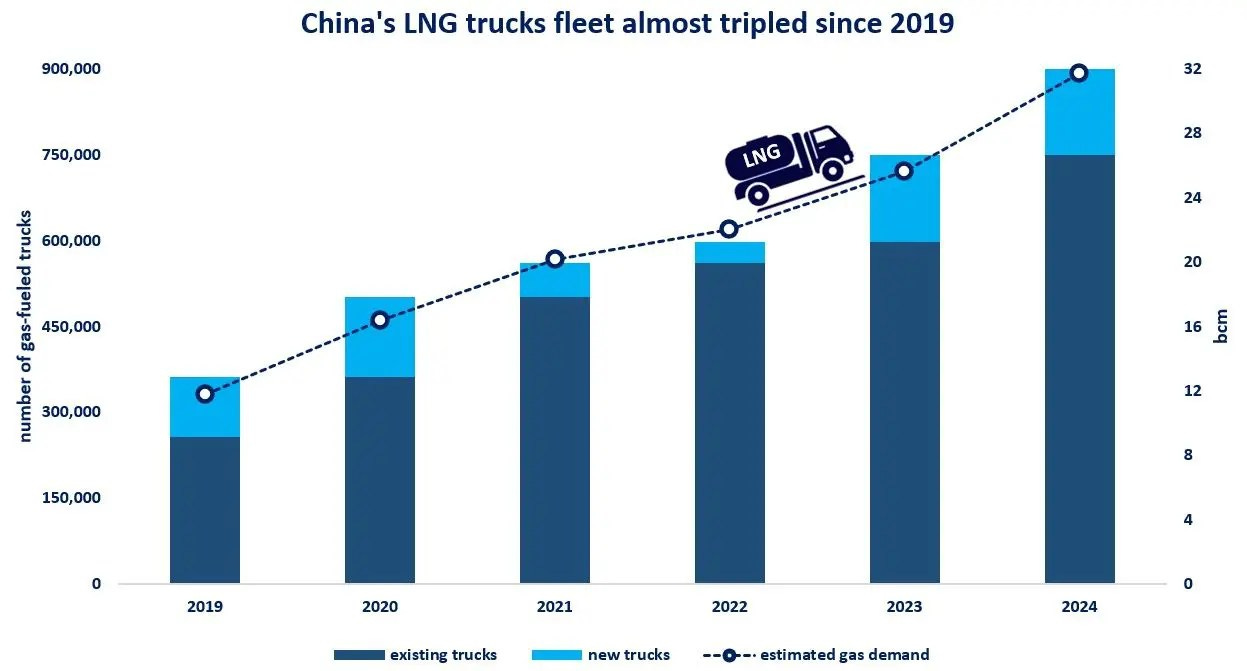
Heavy-duty truck switching to LNG: China’s rapid adoption and scale-up of LNG trucks sales is displacing the consumption of diesel.

China’s LNG truck fleet almost tripled since 2019, with their number expected to reach 1 million in 2025, and according to various sources, they accounted for 20% of new truck sales.
Reduced Refineries’ Throughput: in 2024, China's crude throughput fell 1.9% YoY to 14.19mbd, led by reduced utilisation especially at “Teapot” refineries, which is hovering around 50%. We’ve also seen several smaller refineries closing or going into indefinite maintenance, during the course of 2024.
We believe that the heightened risk of a trade war, is a risk to China in terms of economic growth and, consequently, of oil demand.

If we believe that China oil demand is peaking (i.e. no marginal demand growth from it), it will be “hard” for other countries to replace all that marginal growth.

As an example, India’s oil demand for 2024 is estimated at ca. 5.67mbd, reflecting an increase of 220kbd from 2023 (in comparison Chinese oil demand in 2024 was equal to 16.7 mbd, according to OPEC).
Potential Ukraine-Russia Ceasefire
We’ve seen recent news about ongoing negotiations between the US, Russia and Ukraine on a potential ceasefire in the conflict.
After more than 3 years, it seems that (other than the EU) all parties are more agreeable to sit at the negotiating table and, as we said here, we continue to believe that odds of a peace deal are increasing.
It also seems that, a peace deal “brokered” by the US will also entail some form of sanctions’ relief on Russia; should this lead to Europe starting to re-import Russian crude and oil products (we still believe this to be a low probability event), this would be a substantial risk to crude tanker tonmiles (Kpler estimates that tanker demand could decrease by 8%).
Sanctions
Days before Trump inauguration, we’ve seen how OFAC imposed sanctions on ca. 180 Russian-linked tankers; this initially sparked a “panic mode” among charterers, and pushed VLCC rates to levels not seen since February 2024.

Nevertheless, despite the addition of more vessels to the OFAC sanctioned list (mainly Iranian/Venezuelan linked), VLCC rates have been fading the news and TD3C is back to WS 60.
Worth noting that, on the other hand, Suezmax and Aframax rates have been much stronger, but it is difficult to pinpoint that just to sanctions.
In the past few weeks, we’ve seen an increasingly antagonistic tone from the Trump administration towards Iran and some Iranian-linked vessels have been added to the OFAC list.
This has led to an increase in Iranian oil in floating storage (below), but, so far neither the Russian sanctions nor the Iranian sanctions have had a material impact on utilisation and rates.
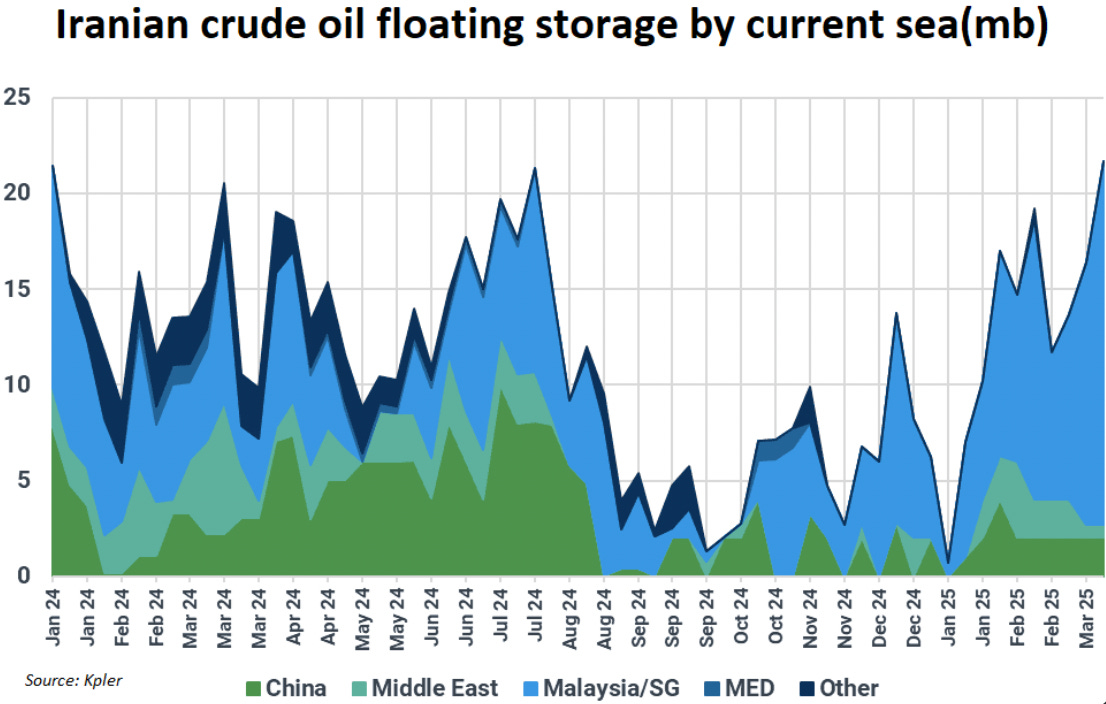
It remains to be seen if the “maximum pressure” policy on Iran will be implemented and if it will work (we live in different times vs Trump 1.0), but surely, should it be the case, it would positively affect the supply/demand balance for crude tankers.
Red Sea
With the end of the Gaza ceasefire, probabilities of a reopening of the Red Sea to commercial shipping has decreased substantially.
In addition to this, the US has started to carry airstrikes against Houthi positions in the past few weeks.
As such, we believe that the base case scenario is that the Red Sea will effectively remained “closed” for 2025.
However, it is worth noting that for product tankers the negative effect of a reopening on demand is estimated at ca. 4%.
Valuation
P/NAV

In this section we are going to analyse the various crude and product tanker companies, based on P/NAV. We have based our P/NAV calculation on the most recent companies’ financials and on April ‘25 vessels’ valuations.
Among product tanker companies, Pyxis Tankers is by far the cheapest company at 0.33, although they also own some dry vessel; looking at pure product tanker players D’Amico and Scorpio trade at just 0.42 and 0.48 P/NAV, respectively.
Due to their higher financial leverage, Torm and Pyxis Tankers have the highest NAV sensitivity to a 10% change in vessel values, while Ardmore is at the opposite side of the spectrum, explained by the fact that it has the lowest net LTV.
All companies are currently trading well below their historical avg. P/NAV.
Moving to crude tankers, Tsakos is by far the cheapest company, trading at 0.27 P/NAV, with Teekay Tankers and International Seaways coming behind at 0.62 and 0.63, respectively.
Worth highlighting that, despite the selloff of the past few months, DHT and Okeanis still trade at (or very close to) NAV, with Frontline coming just behind at 0.88.
Due to their high leverage (>40%), Tsakos, Okeanis and Frontline are the companies with the highest NAV sensitivity to a 10% change in vessel values, while Teekay Tankers has the lowest, given their negative LTV.
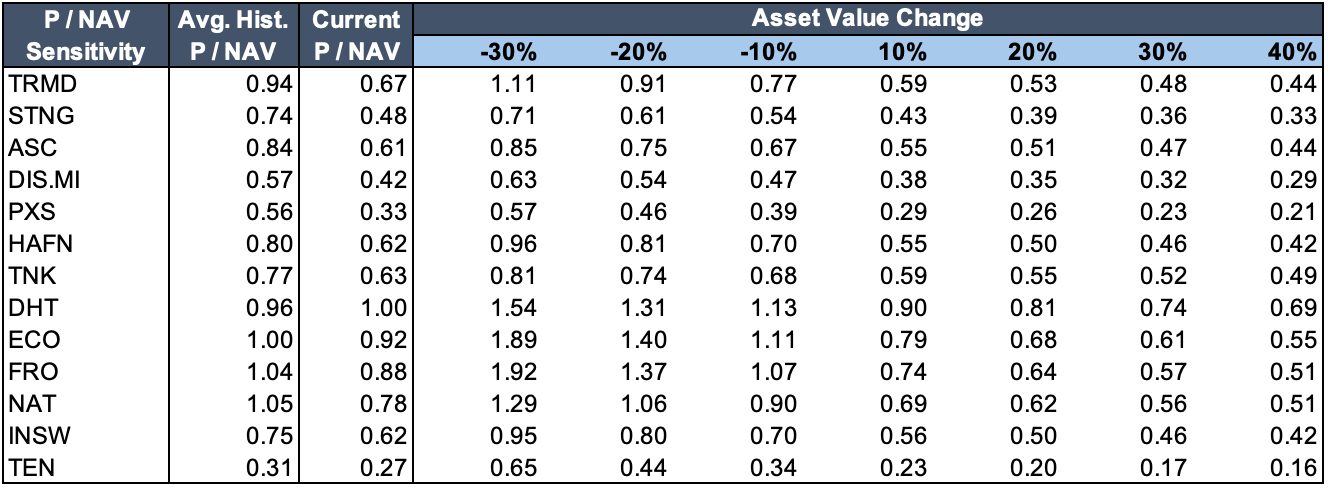
Above a table showing the sensitivities of P/NAVs to changes in vessel values. Given the recent downward pressure on asset prices, it is interesting to see what would be the P/NAV, assuming a 10-20% drop in values.
If we assume a 10% drop in values, all companies would still trade below their respective historical average P/NAV, while at 20%, crude tankers would trade at or above their historical P/NAVs.
This highlights how, from this point of view, equities seem to have a decent buffer.
Nevertheless, this is just one metric and we need to analyse it together with other valuation methods.
Fwd EV/EBITDA and Levered FCF Yield
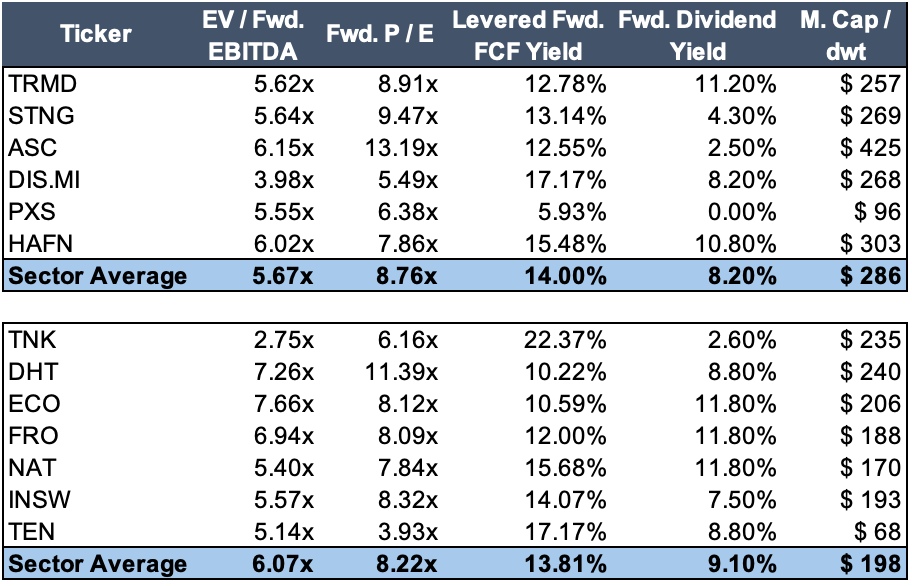
Please note that the above table contains forward figures, which are based on the below assumptions (Non/Non).

Looking at the EV/Fwd. EBITDA, we can see how Teekay Tankers and D’Amico are the cheapest company within crude tankers and product tankers, respectively.
Looking at Levered FCF Yield, again, Teekay Tankers and D’Amico are the cheapest, however we need to take into consideration, especially for Teekay, that they have an old fleet (average age of 14.9 years) and part of the generated FCF will need to be invested in fleet renewal.
Torm, Hafnia, Frontline, Okeanis and Nordic American Tankers have the highest Fwd. Dividend Yield, but its sustainability is questionable looking at the projected FCF Yield.
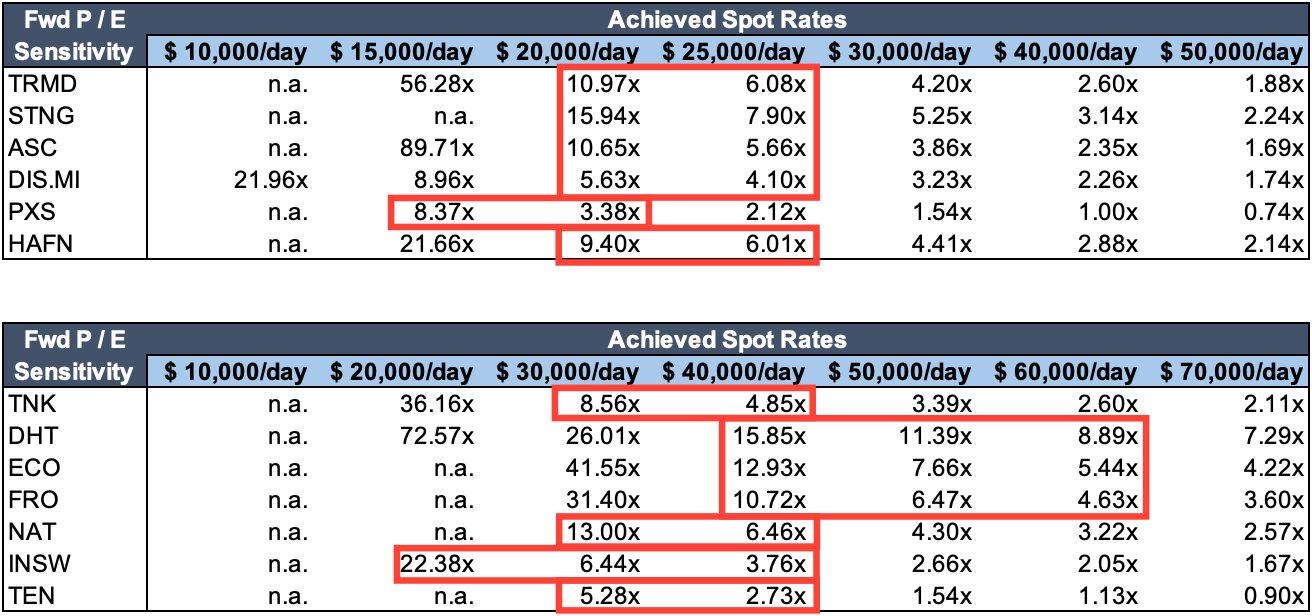
Moving to the P/E sensitivity analysis, we have highlighted in red what we believe are the most probable ranges of achieved TCEs, based on today’s rates assumptions (for the next 12m) and based on each company fleet profile.
As we said in January, the lower end of our expectations would produce high P/E (at or above 10x for all companies, with the exception of D’Amico and Pyxis among product tankers, and Teekay and Tsakos, among crude tankers), while if the market strengthens, we believe that current share prices provide decent entry points.
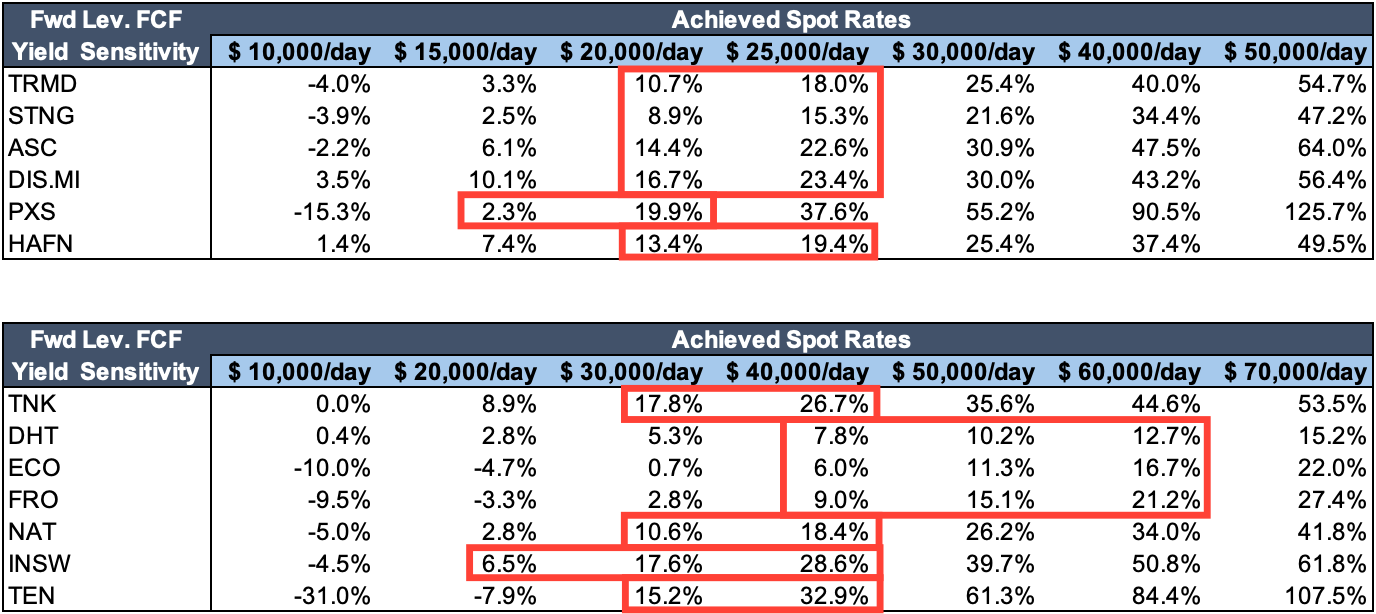
Moving on to Lev. FCF Yield sensitivity, similar considerations can be made.
At the lower end of expectations, all companies should produce decent FCF yields, while at the higher end of expectations (i.e. if the market remains constructive), we might see FCF yields of mid-teens/low-20s.
TCE Performance and Valuation
Finally, it is interesting to see if the TCE out/underperformance of companies is reflected in the most commonly used valuation metrics.
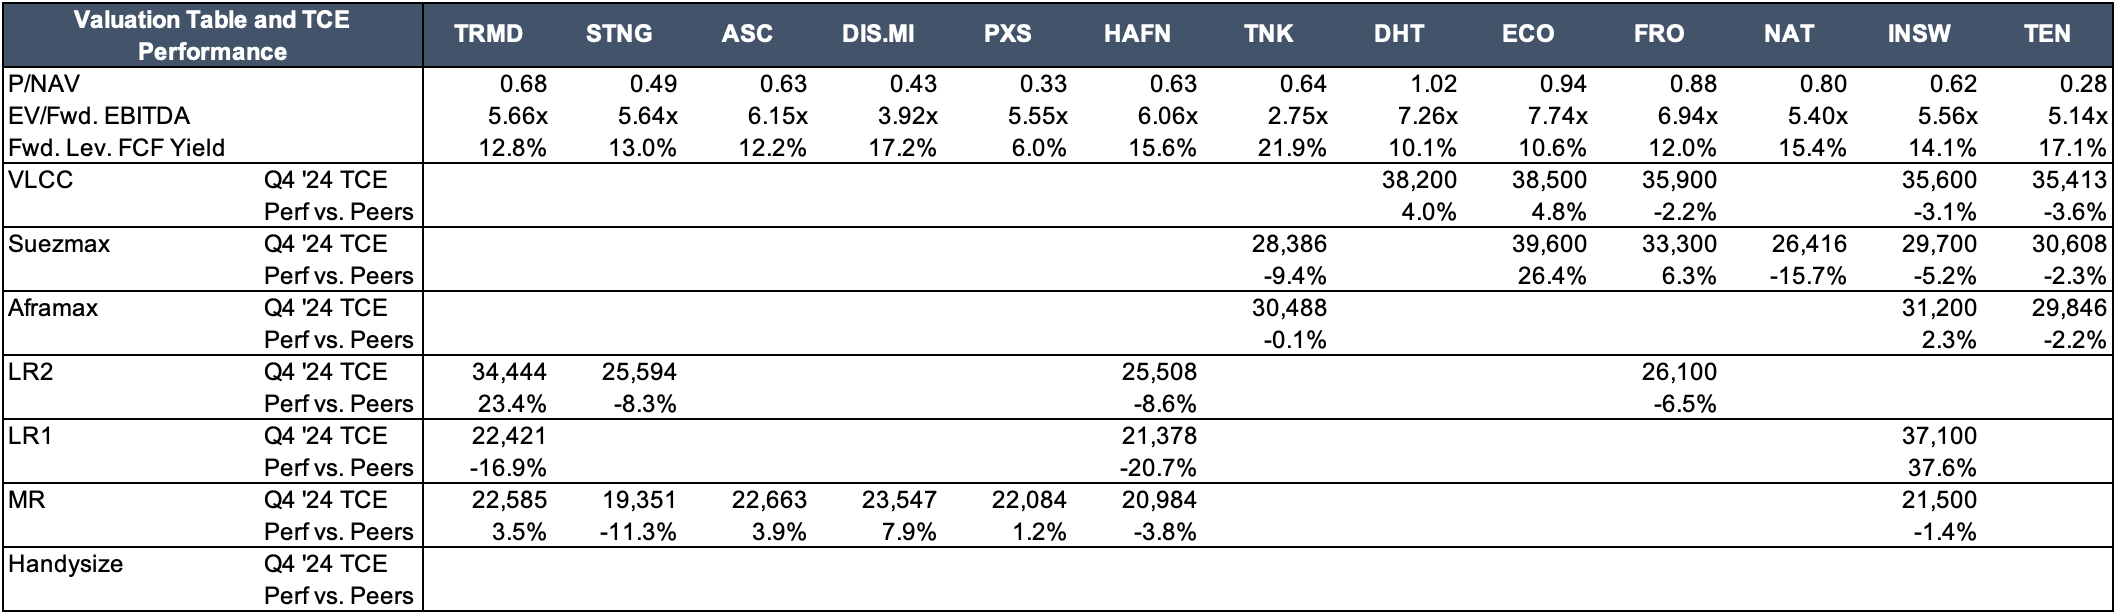
As we said for dry bulk, looking at P/NAV it can be seen how there doesn’t seem to be a clear correlation between TCE performance and discount to NAV.
This can be explained by the fact that there are various other factors that affect the discount to NAV, like distribution policies, quality of corporate governance, future Capex requirements, financial leverage, historical discount to NAV, etc.
Also looking at other metrics (EV/Fwd. EBITDA and Fwd. FCF Yield), we can see how there’s no strong correlation between valuation and TCE performance.
As a final remark, we believe that TCE performance is not the main “driver” of shipping equities’ valuation discounts/premiums, with other factors playing a bigger role.
Wrapping things up, we believe that the supply dynamic for VLCCs is positive, with the potential for this segment to be the real beneficiary of any increase in tensions (sanctions, etc) in the Middle East (i.e. Iran). Nevertheless, risks remain around demand (i.e. China).
As we said in our January update (here), we continue to see falling asset prices as one of the biggest threats to NAVs and, consequently, equities’ prices, given that vessels values continue to be relatively expensive if compared to the cash generation potential of the various segments.
Looking at the smaller crude tankers and product tankers, we cannot ignore the high orderbooks, with a lot deliveries coming in 2025 and 2026.
In relation to this, it is worth noting that, usually, newbuild crude tankers carry clean products on their maiden voyage and this could put further pressure on East-West LR rates (given that in the past 2-3 years deliveries were very low).
Thanks for the write up and the detailed analysis. Could you elaborate on what you believe are the main drivers of shipping equities valuations?
“…As a final remark, we believe that TCE performance is not the main “driver” of shipping equities’ valuation discounts/premiums, with other factors playing a bigger role…”
Impressive article like always, thank you very much for sharing your vision.