


Dry Bulk Equities' Analysis - March 2024

We may have a beneficial long position in some of the shares mentioned via stock ownership, options, or other derivatives.
This presentation expresses the opinion of the author and is provided for informational purposes only and should not be construed as investment advice or an offer or solicitation to buy or sell securities.
The material is not intended to be used as a general guide to investing, or as a source of any specific investment recommendations.
In this post we' are going to have a general overview of the listed dry bulk equities we follow.
We will first analyse fleets’ profiles, then costs (OPEX, G&A) and breakevens, and finally we will look into various valuation metrics (mainly forward looking).
Dry Bulk has become a hot sector in late 2023 and 2024 YTD, with the C5TC reaching $33,300/day on Friday 15th March.
This strength has been due to various factors affecting the dry bulk sector as a whole, like disruption at the Panama and Suez canals, increased iron ore exports from Brazil, high bauxite exports from Guinea and consequent higher Chinese imports, just to name a few.
The companies analysed in this post are:
Genco Trading & Maritime (Ticker: GNK)
Seanergy Maritime (Ticker: SHIP)
Eagle Bulk (Ticker: EGLE)
Diana Shipping (Ticker: DSX)
Safe Bulkers (Ticker: SB)
Golden Ocean (Ticker: GOGL)
Starbulk Carriers (Ticker: SBLK)
Eurodry (Ticker: EDRY)
2020 Bulkers (Ticker: 2020.OL)
Belships (Ticker: BELCO.OL)
United Maritime Corp (Ticker: USEA)
Himalaya Shipping (Ticker: HSHP)
Please read the disclaimer at the top.
Fleet Profiles
Owned Fleets
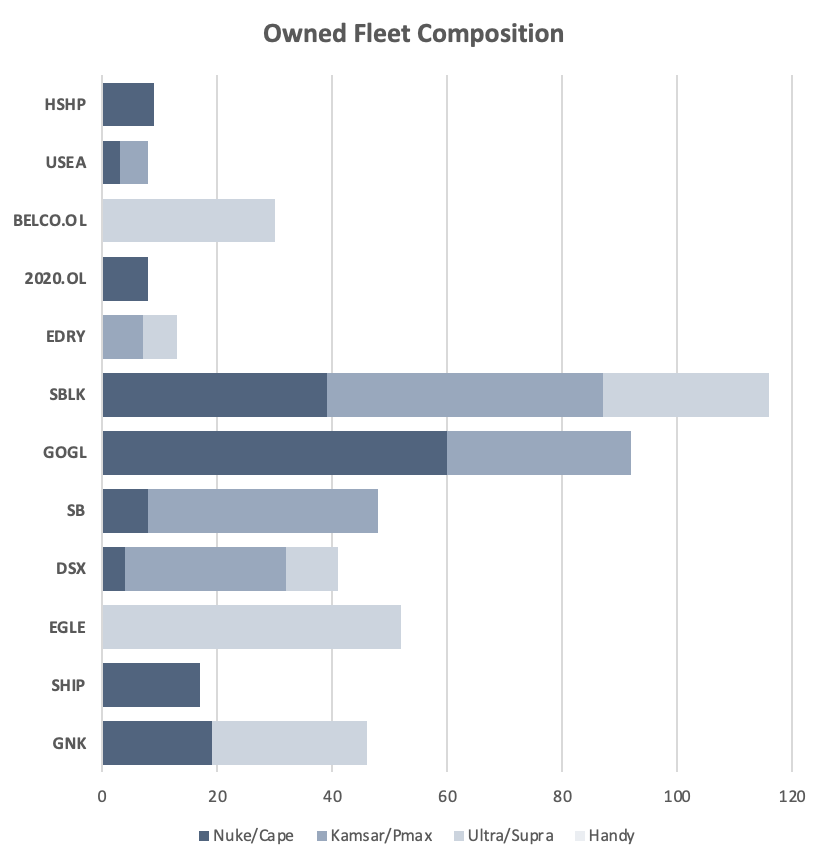
Starbulk and Golden Ocean have the largest fleets, with a total number of owned vessels of 116 and 92 respectively.
Looking at sub-sectors we can see that Seanergy, 2020 Bulkers and Himalaya Shipping are the only pure-play on Nukes/Capes, while in absolute numbers, Golden Ocean has the largest fleet of Nukes/Capes with 60 vessels.
There’s no pure-play on the Kamsarmax/Panamax sector but Diana Shipping, Safe Bulkers and United Maritime have the higher exposure to the segment in percentage terms, at 68%, 83% and 63% respectively.
Finally, looking at the Ultramax/Supramax sub-sector, we can see how Belships and Eagle Bulk have 100% exposure to this segment (to be noted that Eagle Bulk have agreed to merge with Starbulk).
TC-IN and Newbuilds/Acquired Ships

Looking at TC-in vessels, we can see how Starbulk has 7 vessels on long-term TC-in, of which 3 have been delivered (1x Capesize, 1x Kamsarmax and 1x Ultramax) with 3 further Kamsarmaxes and 1 Ultramax to be delivered in 2024.
Safe Bulkers have chartered-in the Arethousa, a 2012-built Panamax vessel.

Looking at newbuilds and acquired secondhand vessels (yet to be delivered), we can see how Safe Bulkers and Belships are the most “active” companies with 7 and 8 vessels to be delivered, respectively.
Fleet Age and Scrubbers

Himalaya Shipping, 2020 Bulkers and Belships are the three companies with the youngest fleets at 0.9, 4.3 and 5.3 years respectively.
To be noted that 3 further newbuildings will be delivered later this year to HSHP, which will lower the average age of its fleet even further.
On the other end of the spectrum is United Maritime, Eurodry and Seanergy with average ages ranging from 13.1 years to 14.8 years.
Consistent with their average age, Himalaya Shipping, 2020 Bulkers and Belships are also the companies with the highest percentage of ECO vessels, while United Maritime and Seanergy the lowest.
In addition to Himalaya Shipping and 2020 Bulkers, the other companies with the highest percentage of scrubber-fitted vessels are Eagle Bulk and Starbulk at 96% and 97%, respectively.
Notable mention to Seanergy, which despite the old age of its fleet, it has 53% of the vessels scrubber-fitted (more than Golden Ocean).
Costs’ Analysis
OPEX and G&A
Safe Bulkers and Starbulk are the two companies with the lowest Opex and G&A expense per day at $6,970 and $6,500 per day respectively.
Safe Bulkers’ Opex are around $700/day lower than peers’ average, with G&A being in line at around $1,500/day.
Looking at Starbulk, we believe the outperformance on costs is due to the economies of scales due to the large platform they have (>100 ships).
At the other end of the spectrum are Seanergy and United Maritime, both ultimately controlled by Stamatis Tsantanis.
Looking at Seanergy, we can see how both Opex and G&A are way above peers, with the latter being more than double the average of other listed dry bulk companies.

Concerning G&A, we can see that a big part of it is made of stock-based compensation. In 2023 total stock based compensation was $9.1m, which equates into ca. $1,500/day in additional G&A expenses.
Debt Analysis
Himalaya Shipping and Belships are the two companies with the highest net leverage at 75.7% and 49% respectively (we include both bank debt and financial leases).
This is logical, given that they are also among the companies with the younger fleets (and hence vessels have a longer useful life to amortise debt).
Genco, Starbulk and Safe Bulkers are the companies with the lowest net leverage at 11.4%, 27.2% and 27.7% respectively.
Despite their older fleets, the two companies controlled by Tsantanis (Seanergy and United Maritime) have a fairly high net leverage at 31% and 49% respectively.
The margin on Belships debt is very low as the vast majority of the fleet has been financed by SLBs (at a fixed bareboat rate) and, as such, with the increase in SOFR, the implied margin is close to zero.
Seanergy and United Maritime pay the highest margin on debt, probably due to their higher leverage on rather old vessels. Nevertheless, if dry bulk markets continue to stay healthy, we might see banks willing to refinance this debt at lower margins, improving the overall cost profile of these companies.
Breakevens
Wrapping things up, on a cash breakeven basis, Himalaya Shipping, Golden Ocean and Seanergy have the highest all-in breakeven.
For the first two this can be explained by the young age of their fleets, while for Seanaergy this is mainly due to both high Opex/G&A and higher financing costs.
At the other side of this ranking, there’s Genco and Safe Bulkers. The former has by far the lowest cash breakeven, thanks to its very low net leverage and debt amortisation profile (no mandatory debt repayments for the whole of 2024).
Valuation Tables
P/NAV
In this section we are going to analyse the various dry bulk companies, based on P/NAV. We have based our P/NAV calculation on the most recent companies’ financials and on March ‘24 vessels’ valuations.
Seanergy and United Maritime are trading at the biggest discount to NAV, while Golden Ocean and Himalaya Shipping at the smallest one.
The average P/NAV is 0.73, highlighting the market has not caught up yet with the recent increase in rates and asset values.
Thanks to their financial leverage, Himalaya Shipping and United Maritime have the highest NAV sensitivity to a 10% change in vessel values, while Genco is at the opposite side of the spectrum, explained by the fact that it has the lowest net LTV.
All companies are currently trading below their historical avg. P/NAV.
EV/EBITDA and Levered FCF Yield
Please note that the table on the right contains forward figures, which are based on the dry bulk FFA curves as of 12th March 2024.
Looking at the EV/Fwd. EBITDA, we can see how Seanergy is again the cheapest company. Notable mentions to Genco and Starbulk which are also cheaper than peers and are considered as having high quality corporate governance and distribution policies.
Looking at Levered FCF Yield, Seanergy, Genco and Safe Bulker are again cheapest. In relation to Safe Bulkers, we need to take into account that they have a considerable orderbook and part of the generate FCF will need to fund yard instalments.
Diana Shipping has the highest Fwd. Dividend Yield, but its sustainability is questionable looking at the projected FCF Yield.
As a final comment, Seanergy is the cheapest company on many metrics, but this is also due to some questionable actions done in the past years (on the other hand, since 2021-2022 they have taken several shareholders’ friendly actions and just announced an increased dividend for Q4 2023).
A question after looking in some detail. SBLK reported for Q4-23 GA 1.104 & OPEX 4.977 so total ~ 6.081 (OPEX & GA/USD day) while you report 6.500. Do you make the adjustments for the items they do not include in their calculation? (like predelivery and one-off expenses?) (if so very well done)
Very good analysis of the sector in very deep detail! Excellent work!